This post was written by me over 2 years ago at syslog.ravelin.com. I've re-posted it here, with slight edits, for posterity.
At Ravelin, we catch fraudsters using machine learning. We extract hundreds of different signals from data that our clients send us — such as the prior fraudulence of a location, the number of devices in a customer’s graph network — in real time through our feature extraction service. We then pass these features through our trained models to produce a likelihood of fraud.
The vast majority of Ravelin is written in Go, and we’ve found it a very effective and robust language for solving the sorts of problems we’re interested in. Speed and type safety, combined with easy concurrency, makes for a good language to use for a machine learning pipeline.
In order to train our models to spot fraud, we firstly build a large dataset offline that matches what we would have known about the customer at any given time point. We’re careful to share the same core feature extraction code offline as we do with our live service: Martin Zinkevich talks about the dangers of training-serving skew in this fantastic guide.
The program that we use for offline feature extraction, which we have not-so-affectionately named bulkfes is highly concurrent, with many goroutines operating in a staged pipeline. The goal is to churn through millions of customer records as quickly as possible to generate gzipped feature sets. All operations in bulkfes are entirely local (no network calls), with minimal state or locks as most data is read only.
This stage had slowed down considerably, causing some frustration at the time it took to run. It now took ≈300μs per record. This may seem like a trivial amount of time, but it soon adds up when you process many tens of millions of records. Given that we want want to minimise the time between building a feature and proving its worth in a model, it became a priority to fix.
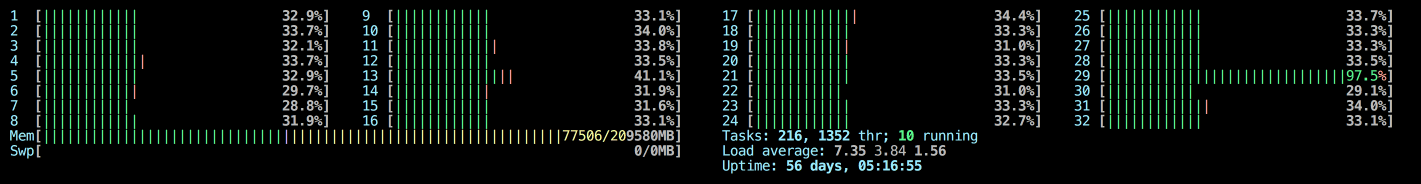
The first sensible thing to do when looking at performance issues is to get a representative dataset that reproduces the issue, fire up your high level profiling tool of choice (I choose htop) and see what’s up. The desired state for our program would be 100% CPU utilisation in user space across all 32 cores from start to end. As we can see, that is very much not the case here. We fire full blast for a few seconds, and then all cores but 1 stop. We pause for a second or so, and restart the loop. Peculiar. Poor goroutine scheduler. At this point, multiple things could be the problem: contention on a mutex, or a tight loop not being preempted by the scheduler being just two of my original suspects. To pprof, we ride!
The profiling tools in Go (pprof being only one of them) are really fantastic. It’s extremely easy to be able to pinpoint hotspots in your program with the CPU profiler, and to identify needless areas of allocation via the heap profiler. Using the web SVG view, I spotted a few easy optimisations that we could make:
strings.Join to join a variadic number of string arguments to build a map key. Variadic arguments in functions generally cause heap allocations. However, these variadic number of arguments were always of length 2, or length 3. I knew from reading my colleague Phil Pearl’s blog on string concatenation that a compiler optimisation existed for string concatenation on a single line. Adding a simple statement to check the length of the strings and build them manually saved unnecessary allocations. Psst. I hear that in Go 1.8, there is a special compiler optimisation for strings.Join as well.These optimisations reduced the total number of allocations we made, reducing pressure on the garbage collector. However, they wouldn’t alone fix the issue of poor CPU utilisation and scheduler thrashing. I proceeded to set the following GODEBUG variables to flush out issues with GC and goroutine scheduling:
gctrace=1: setting this will cause your program to log whenever an garbage collection occurs, with helpful statistics showing the time it took to perform various stages of the garbage collection, the heap size before and after, and more.schedtrace=500: setting this will cause your program to log a summary line of the scheduler’s state every 500ms. It contains useful information about the state of the threads that your goroutines are multiplexed onto, whether they are idle, and how many goroutines are waiting to run.The combined scheduler and GC trace below (some lines have been edited out for clarity) showed that the majority of my non runtime threads sat idle for a second or two just before a garbage collection occurred, marrying up perfectly with CPU graphs. A smoking gun! 🔥
SCHED 307314ms: gomaxprocs=32 idleprocs=0 threads=75 spinningthreads=0 idlethreads=38 runqueue=3 [1 2 1 1 1 1 0 2 4 1 0 1 0 4 0 0 3 0 8 1 0 0 5 2 0 0 2 0 1 1 1 3]
SCHED 307816ms: gomaxprocs=32 idleprocs=0 threads=75 spinningthreads=0 idlethreads=38 runqueue=10 [1 1 0 1 7 1 0 2 1 0 0 0 0 0 0 3 6 0 3 0 1 2 0 4 1 2 3 0 1 0 0 0]
SCHED 308319ms: gomaxprocs=32 idleprocs=0 threads=75 spinningthreads=0 idlethreads=38 runqueue=16 [1 0 0 1 1 1 4 0 4 1 0 0 2 2 0 2 0 3 0 1 0 0 0 0 7 3 2 0 1 1 7 0]
SCHED 308823ms: gomaxprocs=32 idleprocs=27 threads=75 spinningthreads=0 idlethreads=65 runqueue=0 [0 0 0 0 0 0 0 0 0 0 0 0 0 0 0 0 0 0 0 0 0 0 0 0 0 0 0 0 0 0 0 0]
SCHED 313372ms: gomaxprocs=32 idleprocs=31 threads=75 spinningthreads=0 idlethreads=69 runqueue=0 [0 0 0 0 0 0 0 0 0 0 0 0 0 0 0 0 0 0 0 0 0 0 0 0 0 0 0 0 0 0 0 0]
gc 30 @308.778s 0%: 0.89+5809+2.8 ms clock, 28+9849/7842/385+92 ms cpu, 11441->11607->5897 MB, 11734 MB goal, 32 P
Go manages memory for you via garbage collection. This means that the programmer doesn't have to worry about freeing memory after they have used it. It prioritises consistently low latency garbage collection periodically, at the expense of higher CPU usage.
Before this point, I didn’t know a huge amount about the inner workings of the Go garbage collector. In our production services, garbage collection genreally takes up so little time as to not care about, so I’d never concerned myself with it. Upon reading the docs, Go does give you one knob to tune for garbage collection: the environmeent variable GOGC. Quoting from the docs:
The GOGC variable sets the initial garbage collection target percentage. A collection is triggered when the ratio of freshly allocated data to live data remaining after the previous collection reaches this percentage.
Richard Hudson describes the tradeoff perfectly:
‘If you want to lower the total time spent in GC, increase GOGC. If you want to trade more GC time for less memory, lower GOGC’.
Luckily, we have plenty of RAM to trade on this machine. Setting GOGC to 500 had instant effects — increasing throughput significantly, whilst taking around 70GB of RAM at maximum. The reduction in allocations, coupled with increasing GOGC decreased the time per record from 300μs to 110μs — a huge improvement! Building with Go 1.8RC3 instead of Go 1.6 took our time down a further 25μs to 80μs per record. I should have tried that at the start, but hey.
I was happy to stop here. The next bottlenecks lie in the runtime (map related operations) and garbage collection (a re-architecture could reduce allocations further). It’s important to stop and realise when good enough is good enough, as profiling and optimisation is highly addictive. The gradient of time spent on profiling vs. usefulness to your end users flattens very quickly.
In summary, you probably shouldn’t care about shaving microseconds off of functions, unless you call them a very large number of times. Something something, premature optimisation, blah blah. We’ve heard it all before. But if you do want to shave off time because you’re sick of people telling you that, or you want to identify silly things you’re doing that are making your billion function calls slower, Go has an amazing bunch of tools to help you with that.
I’d be remiss not to mention some fantastic reference material that helped me along the way:
Addendum, added June 2019:
Russ Cox, one of the members of the Go team at Google, mentioned that I may have run into a CPU starvation bug present in Go 1.6 that was fixed in Go 1.8. See here for more details.